

.jpg)
In this article
TCF’s research team pulled apart Kickstarter's 2026 numbers to see how backers spend, beyond the headline totals creators chase.
Funding totals get all the attention, but they flatten a much more interesting story happening underneath. Every campaign is a collection of individual decisions, made by people with different budgets, different levels of trust in crowdfunding, and different reasons for pulling out their card.
Behind every funded campaign is a crowd with its own habits, and we wanted a closer look at who that crowd actually is: where they're located, how they pledge, and how many are backing for the first time.
Methodology
This report draws on TCF's analysis of Kickstarter's Technology and Design categories, campaigns launched between April 1 and June 30, 2026. Together the two categories raised about $131 million, roughly 62% of Kickstarter's $210 million Q2 total.
Where Kickstarter backers are located
Across the backers we reviewed, the pool runs heavily American. The US supplied roughly half of all identifiable backers, with the UK, Germany, Canada, and Australia rounding out the next tier.
Shipping and fulfillment planning should center on those five countries rather than spreading logistics thin across a longer list.
Average and median Kickstarter pledge amounts
Once every reward gets converted to USD, two distinct pledge patterns show up by category.
In Technology Kickstarter campaigns launched April to June 2026, the most common pledge sits low, in the $25 to $49 range, but the distribution stretches far upward from there. The median pledge was $194, while the mean climbed to roughly $501, a gap driven by a handful of expensive items pulling the average well past what most backers paid.
In Design Kickstarter campaigns launched April to June 2026, the pattern stays far more contained. The most common pledge sits higher at the low end, around $50 to $74, with a median pledge of $99 and a mean of $140. Median and mean sit close together here because there is no expensive tail dragging the number up.
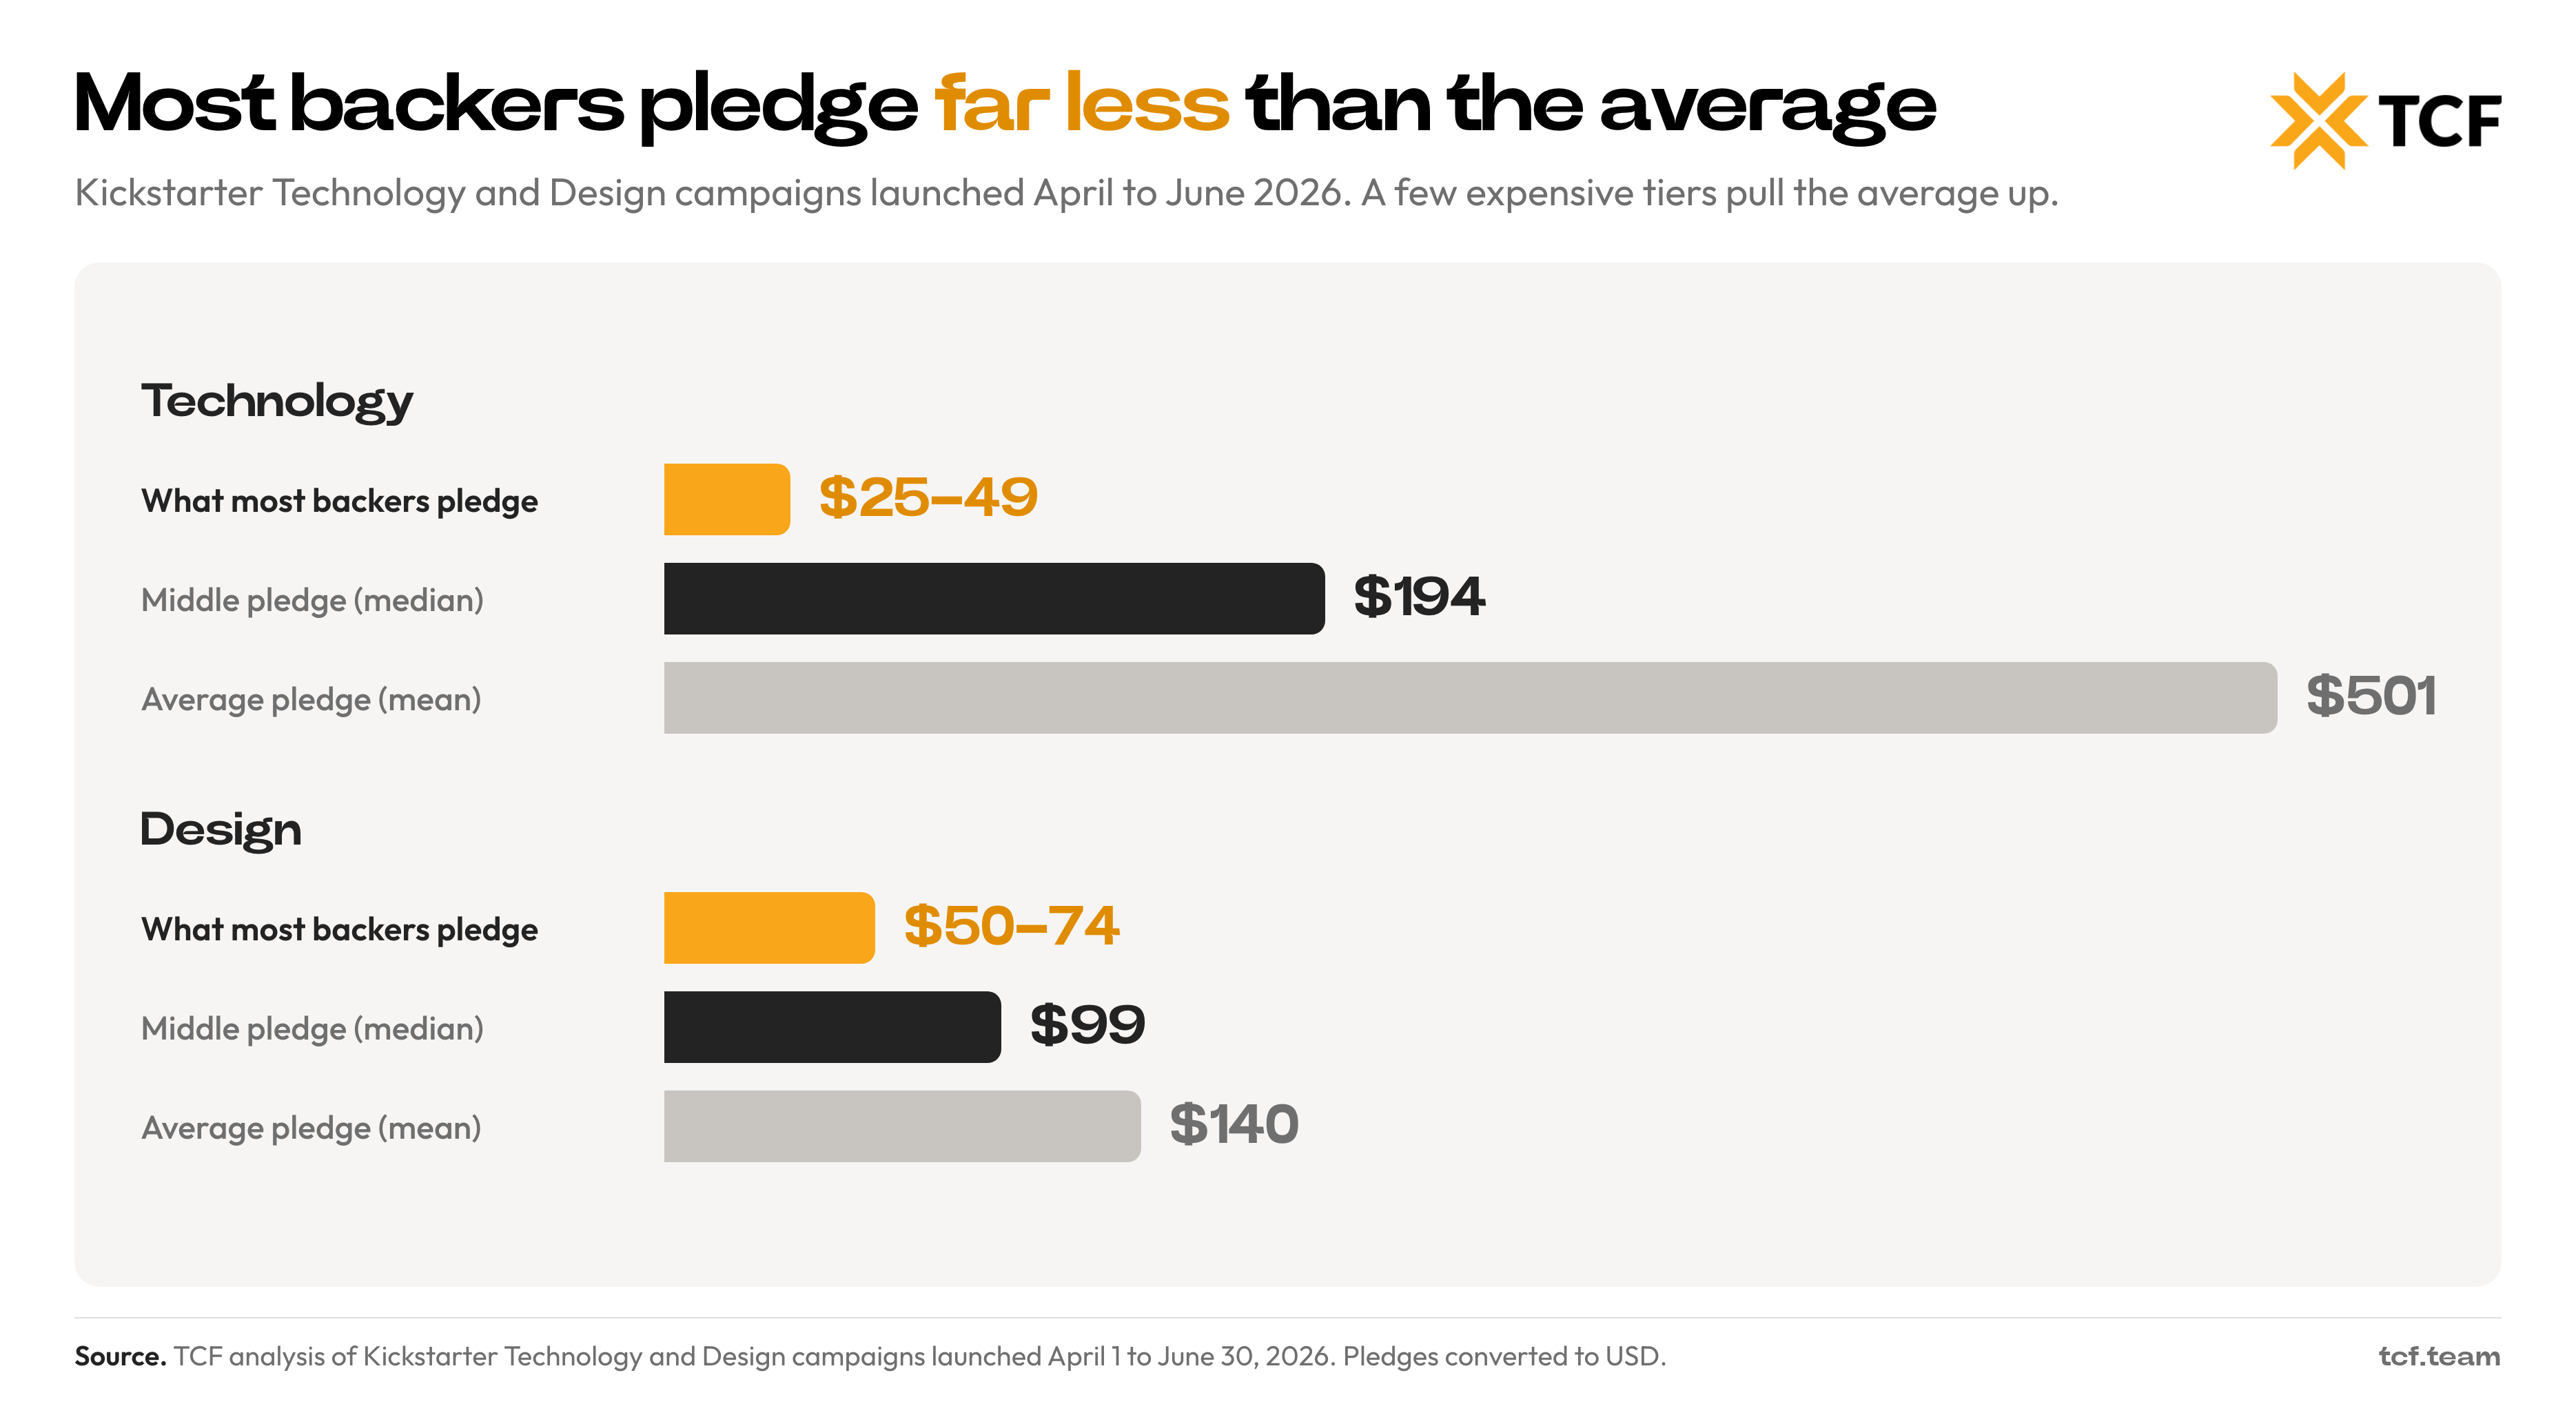
The gap between a campaign's median and mean pledge, wherever it shows up, is the real signal. A handful of premium products can make a campaign's average pledge look impressive while most backers spend far less.
Two decisions follow from that, and they call for different numbers:
- price the entry tier near the mode, where backers actually enter (the $25 to $49 band in Technology, $50 to $74 in Design),
- use the median instead of the mean to forecast revenue per backer or set a funding goal.
Add-ons tell a smaller part of the story. They pull in real money, but stay a modest share of total pledges, around 6% to 7%. The bulk of the revenue comes from the core product tier, not the extras stacked on top. Price that tier right before worrying about upsells.
What percentage of Kickstarter backers are repeat backers
Returning backers made up the large majority of the crowd in campaigns launched April to June 2026, 74% in Technology and 84% in Design. That leaves a smaller slice, somewhere between 16% and 26%, backing for the first time.
Campaign copy can skip the explainer on how backing works and go straight to the product. It also means credibility, a core driver of how backers decide to back a campaign, carries more weight than novelty, since a first-time creator without a track record has more convincing to do than an established brand does, simply because most of the crowd has seen enough campaigns to know what a good one looks like.
First-timers rarely make up the majority of any single campaign's audience. Only a small fraction manage it, somewhere in the range of one in ten campaigns with community data available.
When it does happen, the campaigns that pull it off usually have broad, easy-to-understand appeal rather than a niche pitch. XGIMI's TITAN Noir projector, for example, a $19.3 million Technology campaign priced from $2,999, still pulled 58% first-time backers because the pitch, a sharper picture on your living room wall, needed no explanation.
To convert a new backer, a campaign needs to be simple enough to explain in one sentence and desirable enough that someone who has never pledged to anything before decides this is the one worth trying. A quick test: if a stranger can repeat the core benefit back correctly after hearing it once, the pitch clears that bar.
That's a useful signal for creators worried about relying entirely on an existing crowdfunding audience. Reaching newcomers at scale is possible, but it tends to reward mainstream, easy-to-understand products over specialized ones.
Key Takeaways From the 2026 Kickstarter Backer Data
A few patterns from this data are worth carrying into your own planning.
- Concentrate fulfillment and shipping planning on the US, UK, Germany, Canada, and Australia rather than spreading it across a longer list.
- Price the entry tier near the mode, where backers actually enter, not the mean or median.
- Lean on trust and track record over novelty, since most backers have backed before.
- Aim for broad, one-sentence appeal if reaching first-time backers matters, since niche pitches rarely convert them at scale.
Conclusion
This year's numbers point to a Kickstarter audience that rewards preparation over spontaneity. Backers are experienced, price-sensitive at the entry tier even when they'll spend big further up the ladder, and concentrated enough geographically that fulfillment planning shouldn't be guesswork.
At TCF, we've helped creators raise more than $520M across 1,000+ campaigns, and patterns like these are exactly why we treat pre-launch strategy as more than a formality.
If you're planning your next launch, start with the audience. The backers reading your page have already seen hundreds of campaigns before yours. Build your page like someone who already understands how they buy.
[[cta2]]
FAQ
Where are Kickstarter backers located?
The US supplied roughly half of all identifiable Kickstarter backers in campaigns launched April to June 2026, with the UK, Germany, Canada, and Australia rounding out the next tier.
What is a typical Kickstarter pledge?
Technology pledges on Kickstarter had a median of $194 and a mean of $501, with most backers pledging in the $25 to $49 range. Design pledges had a median of $99 and a mean of $140, with most backers pledging in the $50 to $74 range. These figures cover campaigns launched April to June 2026.
What share of Kickstarter backers are repeat backers?
74% of Technology backers and 84% of Design backers on Kickstarter had backed a campaign before, based on campaigns launched April to June 2026.
What share of Kickstarter campaign revenue comes from add-ons?
Add-ons made up about 6% to 7% of total pledges on Kickstarter campaigns launched April to June 2026, with the bulk of revenue coming from the core product tier.

.avif)
.avif)


.jpg)
%20(1).png)