

.jpg)
At some point, Shopify conversion rate stops feeling like a metric and starts feeling like a verdict.
Traffic looks fine. Ads are running. Emails are going out. Nothing is obviously broken. And yet the number just sits there, quietly suggesting that something is off. Not enough to panic. Enough to make you hesitate before spending another dollar.
That’s usually when someone asks the question out loud.
“Is this a good conversion rate?”
You Google it and immediately regret it. One article says you’re average. Another says you’re underperforming. A third claims anything under five percent needs fixing yesterday. None of them help you decide what to actually do next.
In this article, we’ll break down what a “good” Shopify conversion rate actually depends on, how to read your own numbers without jumping to the wrong conclusions, and how to tell when conversion rate is the thing to fix versus a signal of something else.
You’ll get realistic benchmarks with explanations, clear patterns showing where conversion usually breaks, and practical improvement tips that make sense for how your store actually operates. Plus a framework to decide what’s worth fixing before you spend more on ads.
How Shopify Calculates Conversion Rate
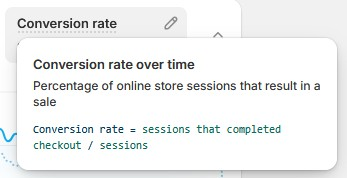
In Shopify, conversion rate refers to online store conversion rate, which measures how many sessions result in an order.
The formula Shopify uses is simple:
conversion rate = number of orders ÷ number of sessions
A session represents a visit, not a person. If the same user visits your store multiple times, each visit counts as a separate session. Conversion rate is calculated using sessions, not unique visitors, which keeps the metric consistent across ecommerce reporting.
Shopify calculates this rate over whatever time range you select in Analytics. Short timeframes can swing quickly based on traffic mix or campaign activity. Longer windows make trends easier to interpret and reduce noise.
This metric focuses only on completed orders. Other actions like email signups, add to carts, or presale registrations are tracked separately and should not be confused with ecommerce conversion rate, which reflects purchases only.
This is why comparing conversion rates across tools or reports can be misleading if one uses users and another uses sessions.
Why “Good Conversion Rate” Is the Wrong Starting Question for Shopify Stores
“Good” sounds like a destination. A line you cross, a box you check, permission to move on.
That’s why it’s misleading.
Conversion rate doesn’t work like a grade on a test. It’s closer to a reflection. It absorbs everything feeding into your store at that moment, traffic quality, intent, device mix, seasonality, offers, pricing, even how aggressively you’re spending on ads that week.
Ask “Is this good?” too early and you skip the more useful question: “What is this number reacting to?”
A 2.1% conversion rate can mean very different things depending on whether most of your traffic is cold paid social, returning email subscribers, mobile users on spotty connections, or high intent search traffic. The number stays the same. The implications don’t.
This is where most stores go wrong. They treat conversion rate as a target to chase instead of a signal to interpret. They start fixing before they’ve figured out what’s actually being reflected.
Before talking about improvement, you need to understand what your conversion rate is responding to. Otherwise, you risk optimizing the wrong thing very efficiently.
What a Shopify Conversion Rate Actually Tells You
A Shopify conversion rate is not a single message. It’s a bundle of signals compressed into one number. When it moves, it’s reacting to changes somewhere else, often several places at once.
The mistake is treating it as feedback on the site alone.
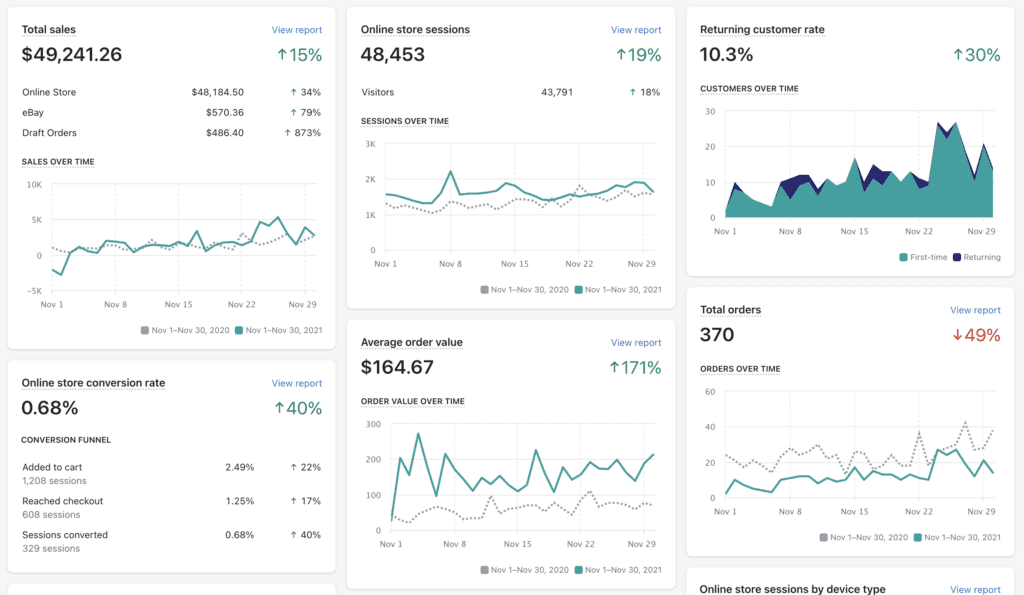
In reality, conversion rate reflects the relationship between who you’re sending to the store, how they arrive, and what they experience once they’re there. If any one of those shifts, the number follows. You can usually see those shifts clearly in Shopify analytics, even when the headline conversion rate feels confusing on its own.
Here are the things that affect conversion rate:
1. Funnel Structure
Conversion rate goes down when people get stuck anywhere.
Someone can like your product, add it to cart, and still leave because shipping feels unclear. Another person might never add to cart because the product page raised one unanswered question. Both count the same in your conversion rate.
That number reflects how many people made it all the way through. It doesn’t show where others hesitated or why they left.
So when conversion rate drops, it usually means something in the path felt harder, not that everything is broken.
2. Industry Expectations
Conversion rate is shaped by the category you’re in.
Some industries come with built-in familiarity. Beauty, supplements, pet, food. Shoppers know what they’re buying and how these stores usually work, which lowers hesitation and pushes conversion rates up.
Other categories ask more from the buyer. Apparel sizing, electronics specs, furniture fit, luxury positioning. These purchases invite comparison and delay. Conversion rates tend to be lower, even when demand is real.
3. Price Sensitivity
Price changes how conversion rate behaves, even within the same industry.
Lower priced products invite faster decisions. The downside feels small, so more people buy on the first visit. Higher priced products introduce hesitation. People think, compare, and come back later.
A store selling a $30 product and one selling a $300 product will not convert the same share of sessions. When price goes up, conversion rate often goes down, even if revenue improves.
4. Traffic Quality and Intent
Conversion rate is extremely sensitive to intent. Warm traffic behaves nothing like cold traffic, even when the site stays exactly the same.
Email subscribers, returning customers, and branded search visitors usually convert at multiples of cold paid social traffic. When your acquisition mix changes, conversion rate changes with it. That does not automatically mean your store got worse.
This is why scaling ads often “breaks” conversion rate on paper. You introduce more people who are earlier in their decision process. The site did not suddenly fail. The audience changed.
5. Device Mix and Mobile Friction
Mobile traffic converts lower than desktop. That’s normal. It’s also easy to forget when looking at a blended number.
If your traffic shifts more mobile heavy, conversion rate usually dips, even if nothing is technically broken. Smaller screens, slower connections, more distractions. All of that shows up in the metric.
A falling conversion rate sometimes says more about where people are browsing than how well your store is built.
6. New vs Returning Customers
Returning customers convert far higher than new ones. When your growth relies more on acquisition than retention, conversion rate often softens.
Blended conversion rates hide this dynamic. A store can improve acquisition, grow faster, and still “look worse” if returning traffic makes up a smaller share of sessions.
Without separating these groups, it’s easy to misread what’s actually happening.
Shopify Conversion Rate Benchmarks
Let’s get concrete.
In practice, the typical ranges we see for Shopify stores tend to sit between 1% and 3%, based on real-world performance across different categories, price points, and traffic mixes. That’s the broad middle. It includes everything from early-stage stores to mature brands, across categories, price points, and traffic mixes.
From there, performance usually clusters like this:
Benchmarks by Industry
Industry shifts these ranges more than most tweaks ever will.
- Beauty, skincare, supplements, pet, consumables: Often 3%-6%, sometimes higher with strong retention.
- Consumer electronics, gadgets: Commonly 2%-3.5%, depending on price and complexity.
- Fashion and apparel: Frequently 1.5%-2.5%, with sizing and returns playing a big role.
- Home goods, furniture, luxury: Often 1%-2%, sometimes lower for higher AOV products.
If your number looks “low” but matches your category and price point, it may be doing exactly what it should.
Desktop vs Mobile Benchmarks
Most Shopify stores see:
- Desktop: roughly 3%-4%
- Mobile: roughly 1.5%-2%
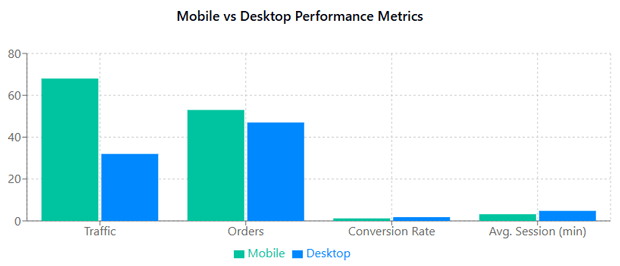
Mobile conversion is often 40-60% of desktop, even for well-built stores. A lower mobile rate is normal. A huge gap is where questions start.
One Important Reality Check
Benchmarks help you orient. But they do not tell you what to fix.
Two stores can both sit at 2.2% and be in completely different situations. One might be struggling to convert. The other might be holding a lower conversion rate while still delivering good ROAS through paid traffic.
Use benchmarks to answer one question only:
“Am I roughly where a store like mine would be expected to land right now?”
Everything else comes next.
A Simple Diagnostic Workflow for Shopify Conversion Issues
Before changing anything in your store, you need to confirm where the problem actually lives. Conversion rate only becomes actionable once it’s segmented.
Break conversion rate apart.
In Shopify Analytics, segment conversion by traffic source, device, and new versus returning customers. If email and returning users remain stable while paid social or mobile drops, the issue is audience mix or experience, not the entire site. Blended numbers hide this immediately.
Locate the funnel step where people leave.
Check the path from product view to add to cart, checkout start, and completed purchase. Shopify’s conversion funnel and behavior reports show where sessions fall off. A drop before add-to-cart points to product page clarity or trust. A drop during checkout points to friction, speed, or payment issues.
Pick one bottleneck and form one hypothesis.
Do not fix everything at once. If add-to-cart rate is low, the hypothesis might involve first-screen clarity or pricing explanation. If checkout completion drops, the hypothesis usually relates to form friction, mobile usability, or payment methods.
Test one change tied to one metric.
Each fix should map to a measurable outcome. Product page changes should aim to lift add-to-cart rate. Cart or checkout changes should affect checkout start rate or payment completion. Avoid judging success on overall conversion rate alone in short tests.
Give the test enough data to mean something.
For most mid-stage Shopify stores, tests need at least one to two weeks or a few hundred conversions per variant to avoid noise. Low-traffic stores should focus on removing obvious friction rather than running formal A/B tests.
Shopify Analytics handles basic segmentation and funnel visibility well. For deeper behavioral analysis, GA4 or session recording tools help confirm causality, especially on mobile.
Practical Ways to Improve Your Shopify Conversion Rate
This is the part where improvement actually happens. Not by chasing clever tricks, but by tightening the parts of the store that quietly decide most purchases.
1. Tighten the First Screen on Your Product Pages
Most conversion losses happen before scrolling. We often see this after traffic scales, especially on mobile, when users land, hesitate, and scroll before engaging because the offer and delivery details are not immediately clear. This is where product page optimization has the biggest payoff because small clarity fixes here affect every visitor who lands.
Make sure the first screen answers three things immediately:
- What the product is
- Who it’s for
- Why it’s worth buying
Price, key benefit, and primary CTA should all be visible without effort. If people need to scroll to understand the offer, conversion will suffer no matter how good the rest of the page is.
2. Reduce Decision Friction, Not Information
People don’t leave because there’s too much information. They leave because the right information is hard to find.
Bring the most common objections closer to the top. Shipping cost, delivery time, returns, sizing, compatibility. If users need to hunt for these answers, many won’t.
Clear answers beat persuasive copy almost every time.
3. Make Trust Obvious Before Checkout
Trust signals work best when they feel calm and expected.
Use reviews, UGC, guarantees, and policies where people naturally look for reassurance, on product pages and in the cart. Avoid overloading checkout with badges or popups. The goal is confidence, not urgency theater.
If someone hesitates right before buying, they’re usually asking, “Is this safe?” not “Is this exciting?”
4. Remove Friction From the Cart
The cart should feel like confirmation.
Show total price early. Be clear about shipping and taxes. Avoid surprise fees or confusing upsells that interrupt momentum. If you use free shipping thresholds, make progress toward them obvious and easy to understand.
Every extra decision here increases abandonment.
5. Simplify Checkout Ruthlessly
Checkout is where conversion gains show up fastest and where small issues have an outsized impact.
By the time someone reaches checkout, the buying decision is largely formed. The experience should support completion with as little effort as possible.
That means removing unnecessary fields, avoiding forced account creation, enabling express payments, and making sure inputs work smoothly on mobile without zooming or awkward tapping. The flow should feel predictable, with no surprise steps or interruptions that force people to stop and think.
In one sustainable fashion store, mobile analysis showed that more than 60% of users dropped off at the shipping information step. Simplifying the mobile checkout flow and enabling address autofill reduced checkout time by 28% and lifted mobile conversions by 47%, which pulled the overall conversion rate back up by 31%.
A smooth, familiar checkout encourages completion and keeps momentum intact, regardless of how much consideration went into the purchase earlier.
6. Fix Mobile Before You Touch Desktop
Most Shopify traffic is mobile. Most conversion issues start there.
Check button sizes, spacing, scroll length, and page speed. Reduce clutter. Remove distractions that push key actions down the page. Test everything with one hand on your phone.
If mobile feels tiring, conversion rate reflects that immediately.
7. Improve Load Speed Where It Actually Matters
Speed matters most on product pages and checkout.
Large images, heavy apps, and unnecessary scripts quietly push users out. You don’t need a perfect speed score, you need pages that load fast enough to keep momentum.
Focus on what loads first, not everything at once.
8. Support the Payment Methods Your Customers Expect
Payment friction kills conversion quietly.
If a customer reaches checkout and doesn’t see a familiar or preferred way to pay, many won’t push through, even if they want the product. This shows up more on mobile, where typing card details feels heavier.
Make sure your checkout supports the payment methods your audience already uses. Credit cards, local wallets, express payments, and installment options where relevant. You don’t need every option under the sun, but you do need the ones your customers consider normal
CRO tools can help surface these issues faster, but they don’t replace clear thinking about where friction actually exists.
When You Should Not Focus on Conversion Rate
There are moments when optimizing conversion rate feels productive but quietly wastes time. If any of the following are true, conversion rate is a symptom, not the problem.
- When Traffic Quality Is the Real Issue
If most of your traffic comes from broad, cold acquisition, a lower conversion rate is expected.
Creative, targeting, and intent mismatches show up as “bad CRO” in dashboards, but the site can only convert the audience it’s given. Pushing harder on site tweaks won’t fix traffic that isn’t ready to buy.
Before optimizing pages, ask whether your traffic is arriving with a clear reason to purchase.
- When the Offer or Positioning Is Unclear
No amount of optimization fixes a weak offer.
If people don’t immediately understand what makes the product different, who it’s for, or why it’s worth the price, conversion improvements stall. This usually shows up as high engagement but low purchase intent.
In these cases, improving messaging and positioning delivers bigger gains than any layout or UX change.
- When AOV or Retention Will Move Revenue Faster
Conversion rate is only one lever.
For stores with strong conversion but thin margins, raising average order value or improving repeat purchase behavior often outperforms chasing small conversion lifts. Bundles, subscriptions, and post-purchase flows compound revenue without needing more traffic.
If revenue is the goal, conversion rate shouldn’t always be the first metric you reach for.
Decision Framework for Conversion Rate Optimization
When conversion rate drops, the fastest mistake is fixing the wrong thing. This table is meant to stop guesswork and point effort in the right direction.
Conclusion
Benchmarks are useful for one reason only: they help you orient.
Knowing that most Shopify stores sit between 1% and 3%, and that strong performance often lives above that, gives you a reference point. It tells you whether you’re roughly where a store like yours would be expected to land, given your category, price point, and traffic mix.
What benchmarks don’t do is tell you what to fix. That’s where interpretation matters.
Improvement works best when it’s focused. Tightening product page clarity, removing friction from cart and checkout, supporting expected payment methods, and fixing mobile usability move conversion more reliably than chasing clever tricks.
Read the number in context, fix what actually blocks buying, and conversion rate stops feeling like a verdict. It becomes a tool for making calmer, better decisions about what to do next.
[[cta5]]


.avif)


.avif)